Average Rice Purity Score by Age: Full Guide (2026)
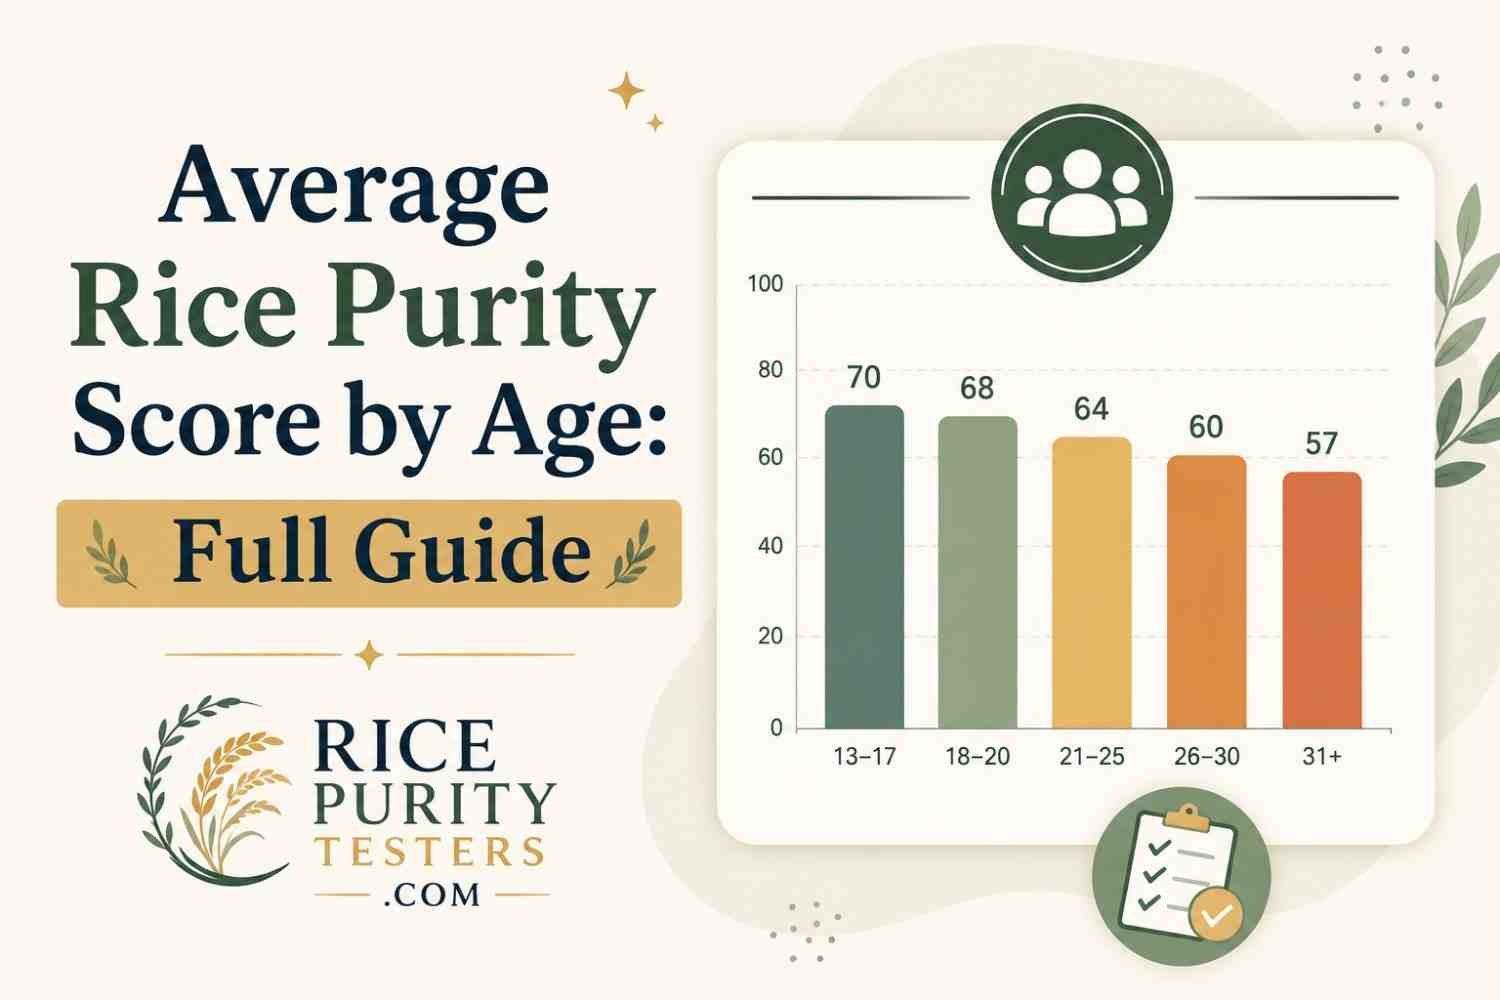
One of the most common things people search for right after taking the Rice Purity Test is how their score stacks up against others their age. It’s a natural instinct humans like context, and a raw number out of 100 doesn’t mean much on its own. This guide walks through the commonly discussed age-based patterns, why they exist, and why “average” is a much fuzzier concept here than it sounds.
Is There an Official Average Score?
No. There is no research institution, university department, or verified survey that publishes an “official” average Rice Purity score by age. What exists instead is a patchwork of informal, self-reported data: social media polls, forum threads, and anecdotal comparisons. Any number you see quoted as “the average for 19-year-olds” should be read as a loose cultural estimate, not a statistic with a citation behind it.
That said, patterns do emerge consistently enough across these informal sources that it’s worth laying them out.
Average Score: Teens (15–17)
Younger teens tend to report the highest average scores, typically landing in the 75–95 range. This tracks with simple logic: many of the test’s 100 questions describe experiences tied to independence, nightlife, relationships, and adulthood milestones that most teens in this age bracket haven’t encountered yet.
Table: Common Teen Score Patterns
| Age | Typical Reported Range |
|---|---|
| 15 | 85–100 |
| 16 | 80–95 |
| 17 | 70–90 |
Average Score: Young Adults (18–22)
This is the age bracket most associated with the test’s origins — college orientation — and it’s also the range with the widest spread of scores. First-year college students often report scores in the 60–85 range, while students further along report scores dropping into the 30–60 range as college life, independence, and new experiences accumulate.
Table: Common Young Adult Score Patterns
| Age/Stage | Typical Reported Range |
|---|---|
| Incoming freshman | 65–90 |
| Sophomore/Junior | 45–70 |
| Senior | 30–60 |
Average Score: Adults (23+)
By the mid-twenties and beyond, reported scores tend to stabilize somewhere in the 30–55 range for most people, though this varies enormously based on lifestyle, personality, and personal choices. Unlike the teen years, where age alone explains most of the variation, adult scores are shaped far more by individual life paths than by age itself.
Why Averages Vary So Much
A few real factors drive the spread far more than any single “average” number can capture:
- Life stage and independence — more independence generally means more opportunity for the experiences the test asks about.
- Cultural and personal values — these shape which experiences someone pursues or avoids entirely, regardless of age.
- Social circle and environment — college campuses, hometowns, and social groups all differ widely.
- Self-reporting bias — people taking the test online may answer more liberally (or conservatively) than they would in a formal survey, since there’s no verification involved.
- Sample bias in “average” claims — most quoted averages come from whoever happened to share their score online, not a representative sample of an age group.
Should You Compare Your Score at All?
Comparing scores can be a fun, low-stakes way to bond with friends or reminisce about shared experiences — that’s largely why the test spread in the first place. But it stops being fun the moment it becomes a source of pressure or judgment. There’s no “right” score for any age, and self-reported online averages are, at best, a loose cultural snapshot rather than a real benchmark.
Frequently Asked Questions
1. Is there a real, verified average Rice Purity score by age? No. All commonly cited averages come from informal, self-reported online sources, not verified research.
2. What’s the average score for a 16-year-old? Informally reported scores for this age tend to cluster in the 80–95 range, though this varies widely.
3. What’s the average score for a college freshman? Commonly reported scores for incoming freshmen tend to fall between 65 and 90.
4. Do scores usually drop as people get older? Generally, yes — more life experience tends to correlate with more “yes” answers and a lower score, though this isn’t universal.
5. Why do college students often see the widest score range? Because college is a period of major life change, so where someone is in that journey (first semester vs. final year) makes a big difference.
6. Is a lower-than-average score for my age a problem? No. Averages here are informal and shouldn’t be treated as a standard to meet or worry about.
7. Do average scores differ by country or culture? Reported patterns can shift somewhat based on cultural norms, though the core test and its scoring stay the same.
8. Why isn’t there an official average? Because the test was never run as a formal, tracked survey — it spread organically through word of mouth and social sharing.
9. Are the averages people post on social media accurate? They reflect real self-reported scores, but they’re not representative samples, so they shouldn’t be treated as statistically reliable.
10. Does gender affect the average score? Any patterns discussed online are anecdotal at best; there’s no verified data breaking down averages by gender.
11. Should teens be comparing scores with older students? It’s generally not a meaningful comparison, since the age gap alone explains most of the score difference.
12. What’s the best way to use an “average” figure? As a loose point of curiosity, not a benchmark — the test was designed to spark conversation, not comparison anxiety.