Rice Purity Test Score Chart: Every Range Explained (2026)
If you’ve just finished the Rice Purity Test and you’re staring at a number between 0 and 100, you’re probably wondering what that number is actually supposed to tell you. The truth is, there’s no official rulebook handed out with your results — no certificate, no verdict, no grade. What exists instead is a general, widely shared Rice Purity Test score chart that internet culture has built up over years of people comparing notes.
This guide lays out that chart in full, breaks down every major score band, and explains what each range tends to reflect in terms of general life experience — without pretending any of it is scientific, official, or something to be judged by.
What the Rice Purity Test Actually Measures
Before diving into the chart, it helps to remember what the test is (and isn’t). The Rice Purity Test is a 100-question self-report quiz that started as a college orientation icebreaker. Every question you answer “yes” to costs you one point off a starting score of 100. Answer nothing, and you keep a perfect 100. Answer everything, and you land at 0.
The questions span a wide range of everyday life experiences — some mundane (holding hands, staying up all night), some more personal. It is not a psychological assessment, a morality test, or a measure of worth. It’s simply a tally of self-reported “yes” answers, phrased as a percentage.
The Full Rice Purity Score Chart
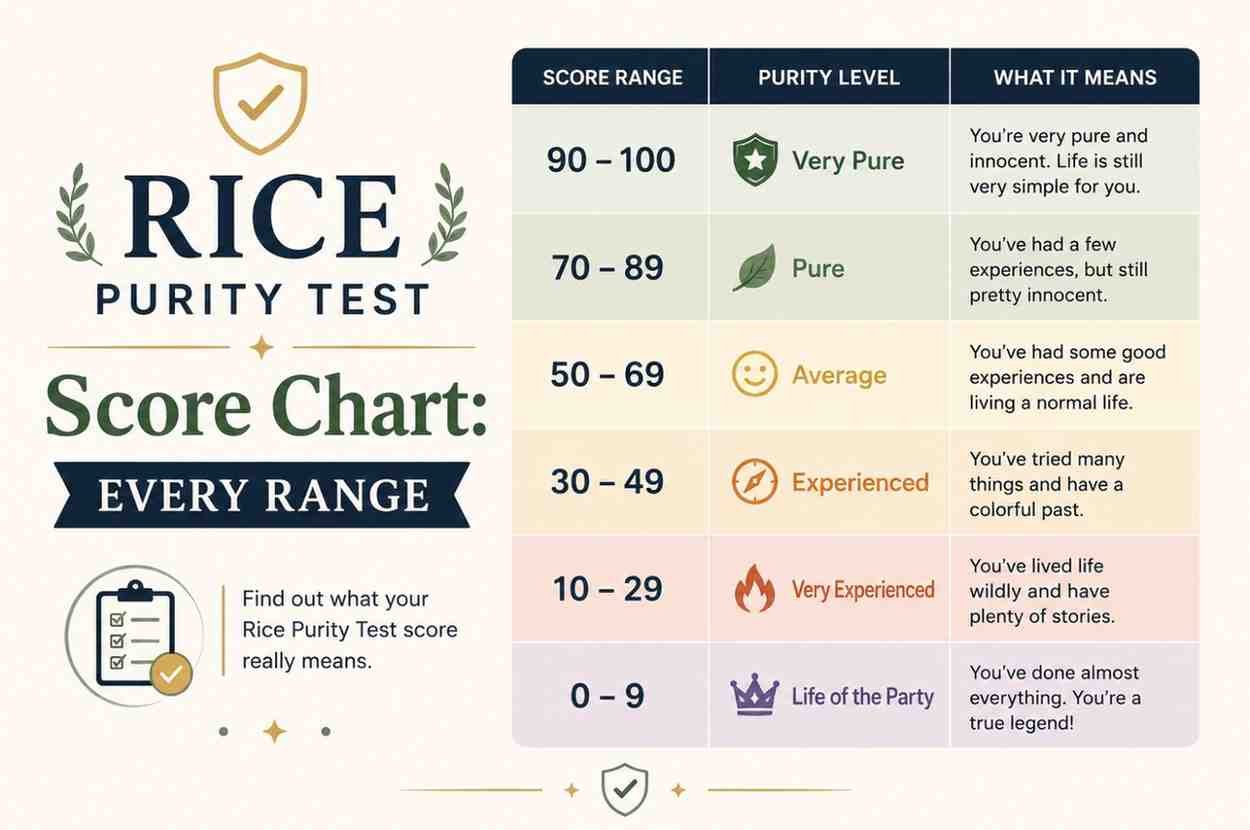
Below is the general breakdown most commonly circulated online. Think of it as a loose cultural convention rather than a fixed standard — different communities and generations shade the boundaries slightly differently.
| Score Range | Common Label | General Description |
|---|---|---|
| 90–100 | Very Reserved | Very few boxes checked; largely untouched by the test’s listed experiences |
| 70–89 | Mildly Adventurous | A handful of common, low-key experiences |
| 40–69 | Well-Rounded | A broad mix of ordinary and more eventful life experiences |
| 20–39 | Very Experienced | Most categories on the test have been checked off |
| 0–19 | Extremely Experienced | Nearly every listed experience applies |
Let’s look at each band individually.
90–100: Very Reserved
Scores in this range are the least common among people who take the test purely out of curiosity, since the questions escalate quickly. Someone here has said “no” to nearly everything the test asks about. This doesn’t necessarily mean a sheltered life — it can just as easily reflect personal values, a cautious personality, age, or simply not having gotten around to many of the listed experiences yet.
What this range often correlates with:
- Younger test-takers, including early high schoolers
- People who lead a routine-focused, low-risk lifestyle
- Personal, cultural, or religious values that shape lifestyle choices
- Simply not having had the opportunity yet
70–89: Mildly Adventurous
This band usually reflects someone who has had a handful of everyday firsts — maybe a first relationship, a school trip, a late night out — but hasn’t ventured much further than that. It’s a common range for younger teens or anyone who leads a fairly quiet, structured life.
Typical experiences in this range:
- Basic social milestones (first crush, first date)
- Minor rule-bending (staying out past curfew, skipping a class)
- Limited exposure to the test’s more mature categories
40–69: Well-Rounded
This is where most adult test-takers tend to land, and it’s often described as the “average” range — though as we’ll cover in a companion article, there’s no verified official average. This band reflects a broad, fairly typical mix of experiences: some tame, some more eventful, spread across many of the test’s categories rather than concentrated in one.
Table: What Often Shows Up in This Range
| Category | Likely Status |
|---|---|
| Social milestones | Mostly checked |
| Travel/independence questions | Partially checked |
| Party-related questions | Mixed |
| More extreme categories | Mostly unchecked |
20–39: Very Experienced
Scores this low usually belong to people who have said “yes” to most of the test’s categories, including several of its more explicit or extreme questions. This range is common among college-age adults who have had a fairly full and varied set of experiences by their early twenties.
0–19: Extremely Experienced
This is the lowest and least common band. A score this low means nearly every item on the 100-question list applies. It’s worth repeating: this number reflects checked boxes on a crowdsourced internet quiz, not a measure of anyone’s character, intelligence, or worth.
What Influences Where You Land
A score is shaped by far more than “how wild someone is.” Age, environment, culture, opportunity, and personal choice all play a role. Two people with very different personalities and values can land in the same range for completely different reasons, and two people with similar lives can land in very different ranges depending on how honestly — or cautiously — they answer.
Why the Chart Shouldn’t Be Taken Too Literally
Because the test was never designed as a scientific or diagnostic tool, the score chart above is best treated as a casual reference point, not a verdict. It’s useful for understanding roughly where your result sits relative to common online discussion, but it says nothing definitive about who you are.
Frequently Asked Questions
1. Is there an official Rice Purity score chart? No. There is no single official chart. The ranges described here are the version most widely circulated online and represent a general consensus, not a verified standard.
2. What is considered a “good” score? There’s no good or bad score — the test isn’t graded that way. A higher score simply means fewer “yes” answers; a lower score means more.
3. What’s the highest possible score? 100, which means every question was answered “no.”
4. What’s the lowest possible score? 0, meaning every question was answered “yes.”
5. Does a low score mean something is wrong? No. It only reflects the number of listed experiences someone has had — nothing about character or worth.
6. Why do most adults score in the 40–69 range? Because that range reflects a broad, typical mix of common life experiences rather than an extreme in either direction.
7. Can two people with the same score have totally different experiences? Yes. The same score can come from completely different combinations of “yes” answers.
8. Does age affect where you land on the chart? Generally, yes — younger test-takers tend to score higher (more “no” answers) simply due to having had less time and opportunity.
9. Is the score chart the same worldwide? Roughly, though cultural context can shift how people interpret or answer certain questions.
10. Should I compare my score to the chart seriously? It’s meant to be a fun, casual reference — not something to overanalyze.
11. Does the chart change over time? The core ranges have stayed fairly consistent since the test became popular online, though exact community labels vary.
12. Is a middle-range score the “normal” one? It’s the most commonly reported range among adult test-takers, but “normal” isn’t really a meaningful label here.